lab_debug Disastrous Debugging
- Wednesday, May 15 at 11:59 PM 5/15 @ 11:59 PM
Assignment Description
Learn how to debug your code!
Introduction to Debugging
Alice is writing an image recognition program. She’s working on the tracing
algorithm, which turns the image into a trace of the outlines in the image.
After going through all the compiler errors (sketchify.cpp:13, etc), the
program finally compiles! Overjoyed to have a program, she decides to test it
on a couple images.
Segmentation Fault
Ouch. What does she do now? She has to debug her code.
Follow instructions from lab_intro on setting up the directory and downloading the code.
You can get the files for this lab by downloading
lab_debug.zip.
Determining What’s Going Wrong
Alice could open sketchify.cpp and try to figure out what’s happening. This
is good for logical bugs — when you only rotate half of your image, for
example, or the image doesn’t rotate at all. Walking through what your code
does to yourself or your partner is a good exercise in debugging bugs in your
algorithm. However, this is often a poor choice for debugging runtime errors or
general code bugs. In this case, you should attempt to use the following
workflow to debug your code (taken mostly from “DEBUGGING: The 9 Indispensable
Rules for Finding Even the Most Elusive Software and Hardware Problems” by
David J. Agans):
Basic Instrumentation: Print (cout) Statements!
The easiest way to debug your code is to add print statements. To do this, you can add comments at various points in your code. We added these statements at the top of the file:
#include <iostream>
using namespace std;
so you can print messages to standard output. Here’s an example:
cout << "line " << __LINE__ << ": x = " << x << endl;
__LINE__ is a special compiler macro containing the current line number of
the file.
The above line prints out the current line number as well as the value of the
variable x when that line number executes, for example:
line 32: x = 3
Print statements work for debugging in (almost) any language and make repeated debug testing easy — to repeat debug testing with a new change, all you need to do is compile and run the program again. They also require nothing new to learn (smile) .
Debugging Alice’s Code
A single test case is provided in the testsketchify.cpp. To compile and run the test, type the following into your terminal:
make test
./test
The test will sketchify the UBC CS logo and compare it against the sample output in the given_imgs folder. The test will pass if the output matches with the sample output.
Alice’s First Bug
As you can see, Alice’s code caused a Segmentation Fault, or segfault. This
happens when you access memory that doesn’t belong to you — such as
dereferencing a NULL or uninitialized pointer.
Try adding print statements to lines 46 and 50, before and after the calls
to original->readFromFile(), width(), and height().
cout << "Reached line 46" << endl;
cout << "Reached line 50" << endl;
Now run sketchify again. You’ll see line 46 print out, but not line 50. This
means the segfault occurred sometime between executing lines 46 and 50. We’ll
let you figure out what the bug here is and how to fix it. You’ll see “line 50”
print to the terminal once you’ve finished — then move on to Bug 2, below.
Bug 2
Once you’ve fixed the first bug, you’ll get another segfault. You’ll want to
narrow down the line it’s occurring on and its cause by printing more
information. Try putting cout statements at the beginning and end of the
inner for loop. Sometimes a bug will cause your program to run in an infinite
loop: you can press CTRL-C to terminate execution.
Note that you will see the following warning when you run “make” - your code will still run with this warning, but you should try to fix this in order to avoid unexpected behavior.
warning: address of stack memory associated with local variable 'pixel'
returned [-Wreturn-stack-address]
    return &pixel;
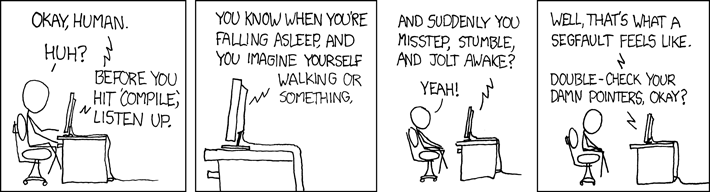
image source: https://xkcd.com/371/
More debugging!
No more segfault! However, the test is still failing. Try to open out.png and compare it with the sample output (see the section below). Once you think sketchify is working, add more tests to testsketchify.cpp with different images.
Alice’s code, like most of ours, isn’t perfect. But fixing it is as simple as repeating the above to learn more about what the program is actually doing at runtime so that you can solve the issues. Read through the specifications carefully and pay attention to the details. Good luck!
Checking Your Output
If the test is unhelpful, you can open each image up using a graphical viewer.
Mac OS users, please install XQuartz, and ensure
you have ssh into the remote ugrad server using the -Y flag:
xdg-open out_icics.png &
xdg-open given_imgs/out_icics.png &
Or compare them using compare:
compare out_icics.png given_imgs/out_icics.png comparison.png
xdg-open comparison.png &
Differences will be highlighted in red.
How good are the tests?
You are probably familiar with the concept of Test coverage from CPSC 210. It measures how much of the source code is executed when a particular test suite runs. To generate a test coverage report, type
make
./test
make coverage
It will compile, run, and generate a coverage report by file in the command line, as well as coverage.html which is a line-oriented coverage report that tells you how many times a line is executed.
Marking Your Work
We’ll be grading all of the labs this semester in part by your attendance in and your attention to the lab. You will let us know you’ve worked on the lab by submitting your work to the autograder in gradescope. We will run a very few simple test cases on your code, and if you pass any of them, you will get credit for the programming portion of the lab. (It’s a low bar.)
You should have received an invitation to log in to gradescope at approximately 8p on Wed, May 08. If you did not receive that invitation, please contact Cinda.
Submitting the lab is as simple as dragging your completed code into the
gradescope interface for the lab_debug assignment.
Please submit the following file:
- sketchify.cpp
Good luck!